| MIGAVIS: Discontinuous Finite Element Visualization
|
| Details |
| Funded by: ENEL Polo Termico | Reference: MIGAVIS |
| Start: 1997-01-01 | Duration: 18 months |
| Partners |
| Contractor: CRS4 | Italy |
Abstract
The aim of this research line is the study and the implementation of appropriate visualization techniques for finite element data in two and three-dimensions. In particular, we are dealing with "unusual" situations such as field discontinuity and deformed cells. Such data are produced for example by chemical simulations, by fluid dynamics simulations, or, in general, anywhere high accuracy on boundary domain description is required.
Objectives
Finite element methods are well suited to represent physical processes in simulation programs. Several applications in the field of fluid dynamics need to represent discontinuous fields defined on finite elements cells. Such data are produced for example as an output from chemical simulation processes.
The combination of discontinuous finite element simulation methods, topologically unstructured grids, and high-order approximations of fields and geometries allows programs to handle a variety of situations in which standard approaches usually fail. In particular, structured grids suffer from heavy limitations when dealing with complicated geometry or when trying to adapt to local features of the solution. Furthermore, discontinuous finite element methods assure time accuracy of the solution to be obtained by using high order polynomial approximations within each element (cell), thus being particularly well suited to unstructured grids. Finally, when high accuracy in the computational domain boundary description is required by a finite element simulation program, it is often necessary to deal with geometrically deformed cells, as the non-linear shape of these cells may give a better approximation of the boundaries than a linear one.
Common visualization approaches do not offer the possibility to handle discontinuities and this research area seems to be completely uninvestigated when discontinuities are combined with unstructured topology.
The aim of our research is to supply general purpose visualization tools for representing meshes made up of topologically different cells (a combination of triangles, quadrilaterals, and other generic convex polygons in the bidimensional case; a combination of tetrahedra together with hexahedra, and generic convex polyhedra in the three-dimensional case) on which discontinuous scalar fields are defined. Also, non-linear parametric description of the geometry must be represented graphically along with the field values defined over it.
Workplan
High order polynomial approximation
All standard visualization tools and techniques are based on the assumption that each variable is defined over a cell has a linear behavior. One of the main problem that as to be faced is to linearly approximate polynomial function for rendering purposes.
In our approach, such linearization has been performed using the Longest Side Midpoint Insertion algorithm, an iterative method where at each step every cell not directly linearizable, with respect to a defined error estimation and a given threshold, is split along its longest side in two cell.
This method has been proven to converge in a finite number of iteration to a linear approximation of the function defined on the original mesh, given a tolerance value, both in 2d and 3d space.
Discontinuity representation
An efficient representation of discontinuities is a major problem to be solved for discontinuous finite element visualization. Discontinuity is a fundamental information in the simulation process: discrepancy in function values at cell interfaces provides informations on solution convergence.
To this aim we decided to handle each cell as a separate entity by representing function value at each vertex independently from the value on the other cells sharing that vertex. This way to describe the actual solution has then been combined with the representation of the average solution obtained by computing for each vertex the value of the function in the cell incident on it. The possibility to describe both actual and average solution is shown to be a good way for emphasizing discontinuities. Both solutions are represented by classical visualization techniques (i.e., by isocontours and color mapping), as described in the following section.
Another approach for discontinuity representation consists in mapping the variance of the discontinuous solution on the edges of the underlying grid. In this way discontinuities are made evident within the mesh and their visualization can be combined with isocontours or color mapping of either the actual or the average solution.
Non-linear geometry
Again, during visualization of this kind of data, the problem resides in representing deformed cells with computer graphics primitive that are linear. The goal is to give a good approximation of such cells with a set of linear cells. We are considering to apply the Longest Side Midpoint Insertion also for this case.
Achievements
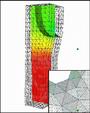
The underlying research work on visualization algorithms has been partially funded by Sardinian Regional Authorities. A first practical result of our research is the implementation of a visualization system for the representation of discontinuous fields defined on unstructured grids. The system, called MIGAVIS, combines different techniques for representing discontinuities on unstructured topologies within a simple parametric user interface. The system is currently being used at ENEL of Pisa (Polo Termico) as an efficient visualization tool for discontinuous data based on finite element analysis obtained from compressible and viscous flows simulation processes.
MIGAVIS has been developed by augmenting the object-oriented Visualization Toolkit (VTK) by Schroeder, Martin and Lorensen with new classes for handling linearization and discontinuity information. The application has been completely developed in C++ and the development platform is IRIX 5.3 Silicon Graphics workstation. A parametric user interface implemented in OSF/Motif allows an easy interaction with data. The system offers the possibility of visualizing:
- the grid in wire-frame on which the solution is defined;
- the actual discontinuous solution;
- the average solution.
Both the actual and the average solution can be described by either a scalar representation (through isocontours or color mapping) or a vectorial representation (through glyphs or hedgehogs). The user can interactively select the scalar field (i.e., a specific solution corresponding to a variable in the simulation process) for scalar visualization and/or the scalar fields for vectorial visualization. The vectorial visualization is simply obtained by combining different scalar solutions.
The variance of the solution can be mapped on edges grid whenever desired, thus emphasizing discrepant values at cell interfaces just in correspondence of their location within the grid. All such visualizations can be combined to produce a single image.
The visualization system is integrated into an interface that gives the possibility to interactively modify the parameters of visualization process, i.e.:
- parameters for linearization process;
- colormaps for variance and for all solution and grid representations;
- value ranges for variance and for all solution representations;
- number of contours;
- glyphs and hedgehogs parameters (height, scale, etc. );
- parameters for linear and non-linear colormaps;
- scale factor for Cartesian axes;
- offset factor for visualized objects with respect to cartesian axes.
Publications
| [1] Andrea O. Leone, Paola Marzano, Enrico Gobbetti, Riccardo Scateni, and Sergio Pedinotti. Discontinuous Finite Element Visualization. In Proceedings 8th International Symposium on Flow Visualization, September 1998. 
|
| [2] Andrea O. Leone, Paola Marzano, and Enrico Gobbetti. Discontinuous Finite Element Visualization. In CRS4 Bulletin 1998, CRS4, Center for Advanced Studies, Research, and Development in Sardinia, Cagliari, Italy, 1998. |
Related videos


 crs4.it